
The Honda Activa remained the highest-selling scooter in India in August 2026, retailing 2,55,815 units against 2,44,271 units a year earlier. TVS Jupiter held second place at 1,47,450 units, and Suzuki Access stayed third at 69,558 units.
The bigger story sits lower down the table. Bajaj Chetak retailed 52,248 units in August 2026, compared with 14,014 units in August 2025, and Hero Vida crossed the 25,000-unit mark with growth of more than 100% year on year. Three of the ten models in this list are electric, and they together account for roughly 17% of the volumes covered here.
All figures in this report come from a single model-level dataset for August 2026 and use the same ten models for the year-ago comparison. The methodology is explained in detail near the end.
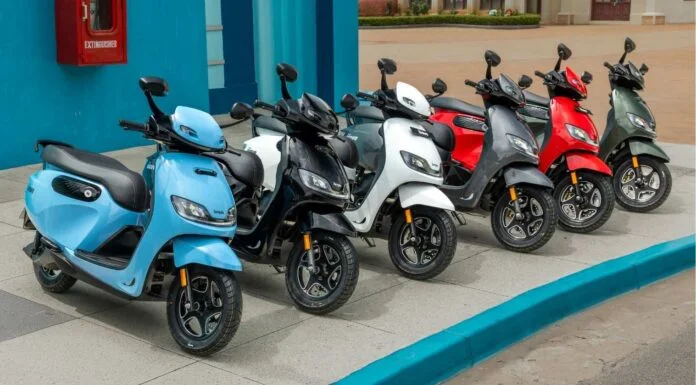
Top 10 Scooters August 2026: Full Sales List
| Rank | Scooter | Aug 2026 | Aug 2025 | YoY Growth | Share of Top 10 |
|---|---|---|---|---|---|
| 1 | Honda Activa | 2,55,815 | 2,44,271 | 4.73% | 35.70% |
| 2 | TVS Jupiter | 1,47,450 | 1,42,411 | 3.54% | 20.58% |
| 3 | Suzuki Access | 69,558 | 60,807 | 14.39% | 9.71% |
| 4 | Bajaj Chetak | 52,248 | 14,014 | 272.83% | 7.29% |
| 5 | TVS iQube | 42,882 | 24,434 | 75.50% | 5.99% |
| 6 | TVS Ntorq | 40,256 | 30,355 | 32.62% | 5.62% |
| 7 | Hero Destini 125 | 29,737 | 19,383 | 53.42% | 4.15% |
| 8 | Honda Dio | 27,670 | 25,632 | 7.95% | 3.86% |
| 9 | Hero Vida | 25,558 | 12,273 | 108.25% | 3.57% |
| 10 | Suzuki Burgman | 25,345 | 24,191 | 4.77% | 3.54% |
| — | Total | 7,16,519 | 5,97,771 | 19.87% | 100% |
A note on the “Share of Top 10” column: this is each model’s share of the combined 7,16,519 units in this table. It is not a share of the entire Indian scooter market.
A note on dataset differences. Some industry reports compile the August 2026 top-10 list slightly differently, with combined totals of around 7,11,435 units or 7,16,519 units depending on which models are aggregated and how. This article uses the 7,16,519-unit composition shown above and applies it consistently to both August 2026 and August 2025, so the year-on-year comparison is like for like.
Ather Rizta, which is reported at 22,586 units for August 2026, does not appear in this particular top 10 because its volume places it just below the Suzuki Burgman. It is discussed separately below.
Honda Activa Sales August 2026
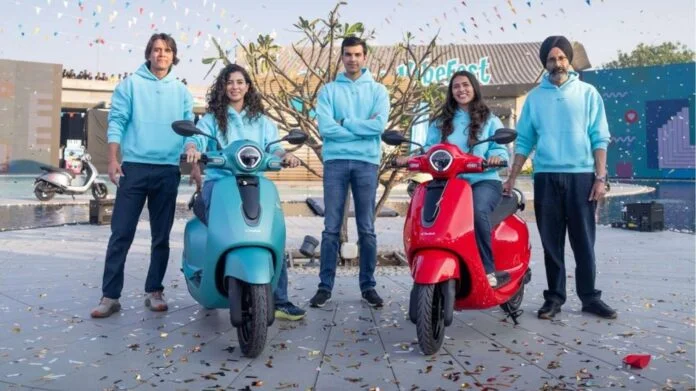
August 2026: 2,55,815 units
August 2025: 2,44,271 units
YoY growth: 4.73%
The Activa recorded the highest sales volume in the selected August 2026 dataset, and by a wide margin. It added 11,544 units year on year, an absolute gain larger than the entire monthly volume of several models in this list.
Its growth rate of 4.73% is, however, one of the slower percentages in the table. That is a function of scale. Activa was already retailing over 2.4 lakh units a month in August 2025, so a 4.73% increase represents a substantial number of vehicles even though the percentage looks modest next to Chetak’s or Vida’s.
The Activa accounts for 35.70% of the combined top-10 volume. No other single model in this list comes close to that share.
[Internal Link: Honda Activa]
TVS Jupiter Sales August 2026
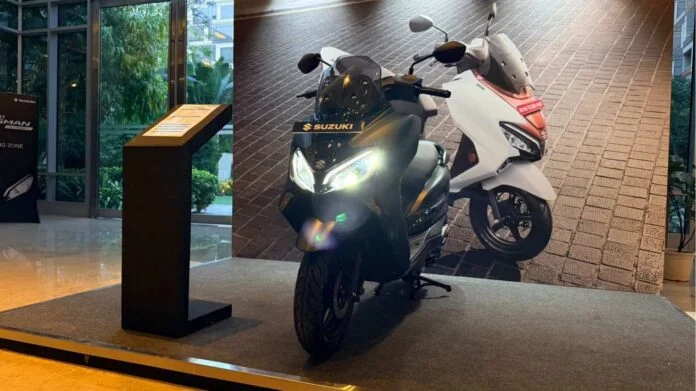
August 2026: 1,47,450 units
August 2025: 1,42,411 units
YoY growth: 3.54%
The Jupiter held second place with 1,47,450 units, up 5,039 units over August 2025. Its growth rate of 3.54% is the lowest percentage in the top 10.
The gap between the Jupiter and the Activa stands at 1,08,365 units for the month. To put that in perspective, that gap alone is larger than the combined sales of Chetak and iQube.
The reported figure covers the Jupiter range rather than a single engine variant. Variant-wise splits between the Jupiter 110 and Jupiter 125 are not available from this dataset and have not been estimated.
[Internal Link: TVS Jupiter]
Suzuki Access Sales August 2026
August 2026: 69,558 units
August 2025: 60,807 units
YoY growth: 14.39%
The Access stayed third with 69,558 units, adding 8,751 units over the year-ago month. Its 14.39% growth is roughly three times the rate recorded by the Activa and four times the Jupiter’s.
It remains the leading 125cc scooter by volume in this dataset, with a gap of 17,310 units over the next 125cc model in the list, the Hero Destini 125.
No claim is being made here about which 125cc scooter is “better” on product grounds. The Access simply recorded the highest retail volume among 125cc models in this dataset.
[Internal Link: Suzuki Access]
Bajaj Chetak Sales August 2026
August 2026: 52,248 units
August 2025: 14,014 units
YoY growth: 272.83%
The Chetak is the standout data point in this table. Volume rose from 14,014 units in August 2025 to 52,248 units in August 2026 — an absolute increase of 38,234 units and a percentage growth of 272.83%.
Read the two numbers together. The percentage is large because the year-ago base was small. The absolute gain of 38,234 units is the more useful figure for understanding what actually changed: Bajaj added more than 38,000 monthly units of Chetak volume in a year.
That makes the Chetak the highest-selling electric scooter in this dataset, ahead of the TVS iQube by 9,366 units. It also places an electric scooter in fourth position overall, behind only the Activa, Jupiter and Access.
This article does not speculate on why Chetak’s volumes rose so sharply. Registration data shows what happened, not why. Attributing the increase to a specific cause would require documented evidence such as pricing changes, network expansion or product launches, and none of that is established by this dataset.
[Internal Link: Bajaj Chetak]
TVS iQube Sales August 2026
August 2026: 42,882 units
August 2025: 24,434 units
YoY growth: 75.50%
The iQube retailed 42,882 units in August 2026, up 18,448 units from 24,434 units a year earlier. It holds fifth position overall and second among electric scooters in this dataset.
Its 75.50% growth rate is strong in both percentage and absolute terms. Unlike Chetak, the iQube was already retailing over 24,000 units a month in August 2025, so the increase is built on a reasonably substantial base.
One clarification worth making: the iQube figure here is a model-level number. It should not be confused with TVS Motor’s total electric two-wheeler retail volume, which includes other models in the company’s electric portfolio and is reported separately.
[Internal Link: TVS iQube]
TVS Ntorq Sales August 2026
August 2026: 40,256 units
August 2025: 30,355 units
YoY growth: 32.62%
The Ntorq recorded 40,256 units, up 9,901 units year on year. Its 32.62% growth is the third-highest percentage among the petrol scooters in this list, behind only the Destini 125 and Access.
It sits sixth overall and fourth among petrol models. The reported figure covers the Ntorq range as defined by the dataset. Variant-wise numbers for the 125 and 160 versions are not available here and have not been estimated.
Hero Destini 125 Sales August 2026
August 2026: 29,737 units
August 2025: 19,383 units
YoY growth: 53.42%
The Destini 125 added 10,354 units over the year-ago month, growing 53.42%. That is the second-highest percentage growth among petrol scooters in this list, after the Access.
It ranks seventh overall. Within the 125cc segment it sits behind the Suzuki Access and ahead of the Honda Dio, though the Dio’s engine range is broader than a single displacement.
No cause is being assigned to the Destini’s growth. The dataset shows the movement in registrations and nothing more.
Honda Dio Sales August 2026
August 2026: 27,670 units
August 2025: 25,632 units
YoY growth: 7.95%
The Dio retailed 27,670 units, up 2,038 units year on year. Its 7.95% growth is modest compared with most of the table, though still positive.
It ranks eighth. The figure refers to the Dio range as defined by the source dataset. Separate sales splits for the Dio 110 and Dio 125 are not available and have not been created for this article.
Hero Vida Sales August 2026
August 2026: 25,558 units
August 2025: 12,273 units
YoY growth: 108.25%
Vida more than doubled its volume year on year, rising from 12,273 units to 25,558 units — an absolute gain of 13,285 units and a growth rate of 108.25%.
This is the third-highest percentage growth in the table, behind Chetak and iQube. Vida ranks ninth overall and third among electric scooters in this dataset.
Two clarifications. First, the Vida figure here is a model-family number covering the Vida range, not a single variant. Second, it should not automatically be treated as identical to Hero MotoCorp’s total electric two-wheeler retail volume, since the two figures may be compiled on different bases.
[Internal Link: Hero Vida Electric Scooters]
Suzuki Burgman and Ather Rizta Sales August 2026
Suzuki Burgman
August 2026: 25,345 units
August 2025: 24,191 units
YoY growth: 4.77%
The Burgman takes tenth place in this dataset with 25,345 units, up 1,154 units over the year-ago month. Its 4.77% growth is similar to the Activa’s — modest in percentage terms, positive in absolute terms. The reported figure refers to the Burgman Street range as defined by the dataset. Burgman Electric volumes have not been added, since the dataset does not identify them separately.
Ather Rizta
August 2026: 22,586 units
The Ather Rizta is reported at 22,586 units for August 2026, which would place it eleventh in this particular dataset — about 2,759 units below the Burgman. It therefore does not appear in the top 10 above.
This is exactly the kind of situation where datasets diverge. Some industry reports compile their top-10 lists with different model aggregation rules, and depending on those rules the Rizta may or may not appear. Rather than force it into a list where the underlying numbers do not place it, this article reports it separately and explains why.
[Internal Link: Ather Electric Scooters]
Petrol vs Electric Scooters
Three of the ten models in this dataset are electric: the Bajaj Chetak, TVS iQube and Hero Vida.
| Category | Aug 2026 Units | Share of Top 10 |
|---|---|---|
| Electric (Chetak + iQube + Vida) | 1,20,688 | 16.84% |
| Petrol (remaining seven models) | 5,95,831 | 83.16% |
| Total | 7,16,519 | 100% |
Electric scooters account for roughly 16.8% of the combined top-10 volume in this dataset. Two of them — the Chetak and iQube — sit in the top five overall.
It is important not to overstate this. The top-10 list covers ten specific models, not the entire Indian scooter market, and it excludes electric models that did not make the cut, including the Ather Rizta. Petrol scooters continue to account for the large majority of volume in this dataset. Any claim that EVs have overtaken petrol scooters in the overall market is not supported by these numbers.
What the data does show is that electric models are now present at meaningful volume in the upper reaches of the scooter sales table, rather than sitting only in the lower ranks.
Which Scooters Grew the Most in August 2026?
Percentage growth and absolute growth tell different stories here, and it is worth looking at both.
Highest percentage growth:
| Model | YoY Growth |
|---|---|
| Bajaj Chetak | 272.83% |
| Hero Vida | 108.25% |
| TVS iQube | 75.50% |
| Hero Destini 125 | 53.42% |
| TVS Ntorq | 32.62% |
Highest absolute increase in units:
| Model | Units Added |
|---|---|
| Bajaj Chetak | +38,234 |
| TVS iQube | +18,448 |
| Hero Vida | +13,285 |
| Honda Activa | +11,544 |
| Hero Destini 125 | +10,354 |
The Chetak leads both lists, which is unusual and reflects just how small its August 2025 base was. But note how the two lists diverge below that. The Activa’s 4.73% growth rate places it near the bottom in percentage terms, yet its absolute gain of 11,544 units puts it fourth on the volume list. Meanwhile the Destini 125’s 53.42% growth looks far more impressive as a percentage than the Activa’s, but it added 10,354 units — slightly fewer than the Activa.
The lesson is straightforward: a high percentage does not automatically mean a larger volume gain.
August 2026 Scooter Sales: Key Takeaways
Every model in the list grew year on year. All ten entries recorded positive growth compared with August 2025. That is a broad-based result across petrol and electric models alike.
The top three positions were unchanged in order. Activa, Jupiter and Access occupy the same ranking as the year-ago comparison, with the same relative gaps broadly maintained.
Electric models now hold two of the top five positions. The Chetak is fourth and the iQube is fifth in this dataset.
The combined top-10 volume rose 19.87%. From 5,97,771 units in August 2025 to 7,16,519 units in August 2026 — an increase of 1,18,748 units.
Volume is heavily concentrated at the top. The Activa and Jupiter together account for 56.28% of the top-10 total. The bottom five models combined account for 21.11%.
Growth rates varied widely. From 3.54% for the Jupiter to 272.83% for the Chetak — a spread that reflects very different base volumes as much as different momentum.
Industry Context: Wholesale Scooter Data
The model-level table above covers ten specific models. Separately, SIAM-based reporting indicates that domestic scooter wholesales across the industry reached approximately 8,55,715 units in August 2026, up 23.76% from 6,91,430 units in August 2025.
This is a different measure and should not be mixed with the model-level table.
Wholesale/dispatch data reflects vehicles dispatched from factories to dealers. Model-level retail data reflects vehicles registered or sold at the retail end. The two can move at different rates in any given month, because dealer inventory builds and draws down over time.
The wholesale figure covers the entire scooter market, including models and manufacturers not listed in the top 10 above. It is useful for understanding overall industry direction. It cannot be compared directly against the 7,16,519-unit top-10 total, because the two numbers measure different things over different scopes.
Sales Data Methodology
A few points readers should keep in mind when interpreting this report.
Source and basis. The model-level figures are August 2026 sales data for scooters, compiled on a consistent basis for all ten models in the table. The year-on-year comparison uses the same ten models in both periods, so the growth calculation is like for like.
Retail versus wholesale. Model-level sales figures and SIAM wholesale figures are separate datasets with different definitions. This article keeps them in separate sections and does not combine them.
Dataset variation. Different industry reports compile model-level rankings with slightly different aggregation rules. Some combined totals for August 2026 sit around 7,11,435 units and others around 7,16,519 units, depending on which models are included and how ranges are defined. This article uses one composition consistently and notes where a model such as the Ather Rizta falls just outside it.
Model ranges, not variants. Where the source reports a range — such as the TVS Ntorq range, the Honda Dio range or the Hero Vida range — the figure covers the range as defined. Variant-level splits have not been estimated.
Percentage rounding. YoY percentages are calculated as ((August 2026 − August 2025) ÷ August 2025) × 100, rounded to two decimal places. Small differences against other publications may reflect rounding or dataset differences.
Figures may be revised. Monthly sales and registration data can be updated after initial publication as late entries are processed.
FAQs
Which was the best-selling scooter in India in August 2026?
The Honda Activa recorded the highest sales volume in the selected August 2026 dataset, at 2,55,815 units.
How many Activa scooters were sold in August 2026?
2,55,815 units, compared with 2,44,271 units in August 2025 — growth of 4.73%.
How many TVS Jupiter scooters were sold in August 2026?
1,47,450 units, up from 1,42,411 units a year earlier.
How many Suzuki Access scooters were sold in August 2026?
69,558 units, compared with 60,807 units in August 2025.
How many Bajaj Chetak scooters were sold in August 2026?
52,248 units, against 14,014 units in August 2025 — an increase of 38,234 units.
Which electric scooters were among the top 10 in August 2026?
Three: Bajaj Chetak (4th), TVS iQube (5th) and Hero Vida (9th). Together they accounted for roughly 16.84% of the combined top-10 volume in this dataset.
How much did scooter sales grow in August 2026?
Among the ten models in this dataset, combined volume rose 19.87% year on year, from 5,97,771 units to 7,16,519 units. Industry-wide domestic scooter wholesales rose 23.76% over the same period, on a different measurement basis.
Which scooter recorded the highest YoY growth?
The Bajaj Chetak, at 272.83%. That figure is influenced by its relatively small August 2025 base of 14,014 units.
How did Chetak sales compare with August 2025?
Chetak rose from 14,014 units in August 2025 to 52,248 units in August 2026, an absolute gain of 38,234 units.
What is the difference between retail scooter sales and wholesale scooter sales?
Retail sales reflect vehicles registered or sold at the dealership end. Wholesale figures reflect dispatches from factories to dealers. The two can diverge in any given month as dealer inventory changes, so they should not be compared directly.
Why is the Ather Rizta not in this top 10?
Its reported August 2026 volume of 22,586 units places it just below the Suzuki Burgman (25,345 units) in this dataset, so it ranks eleventh. Other datasets using different aggregation rules may place it inside the top 10.
Final Notes
August 2026 was a broadly positive month for the models in this list. Every one of the ten grew year on year, and the combined volume rose 19.87%. The Activa, Jupiter and Access held the top three positions in the same order as the year-ago comparison.
The most significant movement came from electric models. The Chetak’s rise to fourth place and the iQube’s fifth-place finish put two EVs in the top five, while Vida more than doubled its volume. Even so, petrol scooters still account for over 83% of the volume in this dataset, and the overall market remains petrol-dominated.
The main caution for readers is dataset variation. Model-level rankings for August 2026 differ slightly between sources, and the Ather Rizta sits right on the boundary. This article has used one consistent composition for the table and the year-on-year comparison, and has reported the Rizta separately rather than adjusting the list to fit it in.